


From coalition arithmetic to population change, local industries and municipal performance, our political data partner helps Truth Report ask better questions about who governs and what residents experience.
A party can win the most votes and still struggle to govern. A rival can lose support yet remain central to the coalition negotiations. Understanding a municipal election means looking beyond the biggest number on the results board.
That is where Norsira, Truth Report’s political data partner, helps us get closer to the truth. Its council-by-council analysis brings election history, polling, by-elections and possible governing arrangements into the same picture. It gives our reporting a way to test political claims against the numbers required to take power.
Its platform widens that enquiry beyond the election itself. Alongside political-control and party-performance tools, Norsira offers population comparisons, profiles of local industries, reported-crime analysis and a municipal performance scorecard. These provide different ways to investigate the conditions in which a council operates. Some platform pages require an account.
The population page separates growth in the number of residents from changes in a municipality’s share of the national population. A town can grow while accounting for a smaller share of the country. For reporting, that distinction opens useful questions about demand for housing, water and other services. Population change alone cannot tell us whether the administration has kept pace.
The economics page identifies leading industries and records the basis for its classifications. Its confidence measure concerns the strength of the evidence, not the size or success of the local economy. For a reporter, identifying a mining, agricultural or logistics economy can help frame questions about jobs and infrastructure; it does not establish that the council is well run. Norsira’s methodological notes make those limits visible.
There is an important qualification: when reviewed on 4 November, the population, economics and crime pages all carried notices that validation was still in progress. Their outputs should be treated as provisional. Their value at this stage is as a structured starting point for further reporting, with figures checked against the underlying sources before being used as firm findings.
The crime tool illustrates the care required. Its stated coverage runs from the 2005/06 to the 2022/23 financial year, using SAPS reported-crime data allocated to municipal boundaries through COGTA’s Indicator Atlas. It is historical coverage, not a picture of crime in 2026. Norsira explains that reported incidents cannot capture all crime, missing data must not be read as zero, and small case counts can produce large movements in a rate.
The map also compares councils with one another within a selected year. A colour is therefore a relative position, not proof that crime has risen or fallen over time. Those distinctions help Truth Report ask what a statistic actually measures before turning it into a headline.
Norsira’s 2 November election outlook assesses 213 councils. It places 43 in its Safe category and 170 in the wider In Play group: 48 Leaning, 88 Open and 34 Turnover Likely. Of those 34 potential changes, 22 are in KwaZulu-Natal. These are Norsira’s assessments, with no probabilities attached.
The distinction matters. A scenario describes what an outcome would require. It does not establish that the outcome will happen. Norsira’s public Johannesburg analysis makes that boundary explicit: the vote shares in its seat scenarios are analyst assumptions, not forecasts or polling results.
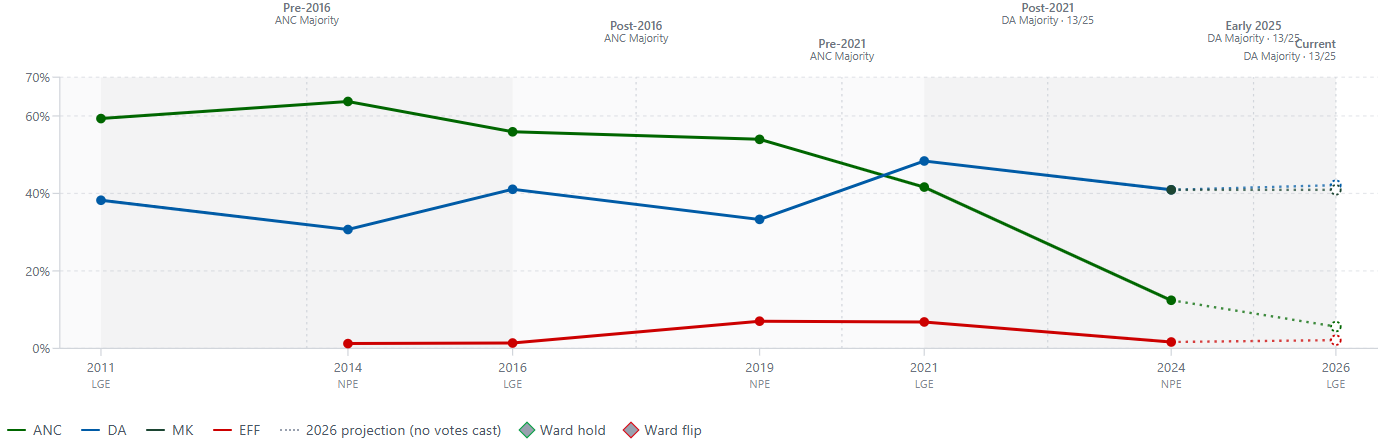
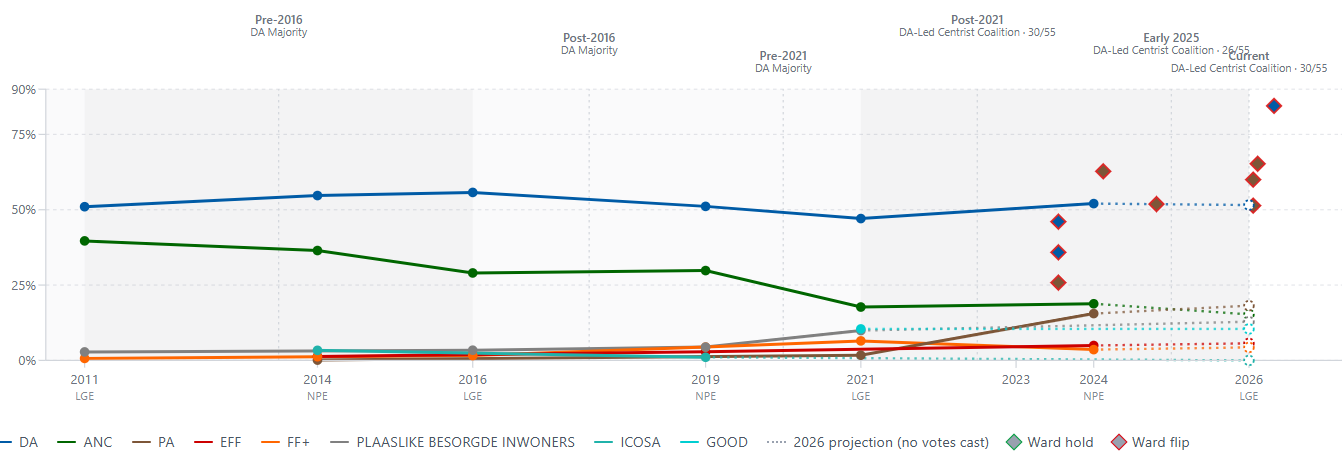
The same care applies to the visuals below. LGE marks local government elections; NPE marks national and provincial elections. These involve different electoral contests. Dotted extensions on the historical charts are projections, while the Johannesburg polling chart separately identifies polls and fitted trends. None is a counted result for a future election.
South Africa’s municipal elections combine ward representation and proportional representation. A ward result, a municipality-wide vote share and a potential coalition’s combined seats therefore answer different questions.
Johannesburg shows why those distinctions are useful. Norsira’s public base case gives the Democratic Alliance (DA) 109 seats, making it the largest individual party in the assumed council. Yet the African National Congress (ANC), Economic Freedom Fighters (EFF), uMkhonto weSizwe (MK), Patriotic Alliance (PA), ActionSA and South African Communist Party together reach 143 seats, above the stated 136-seat majority threshold. That is the arithmetic of a possible bloc, not an agreement between its members.
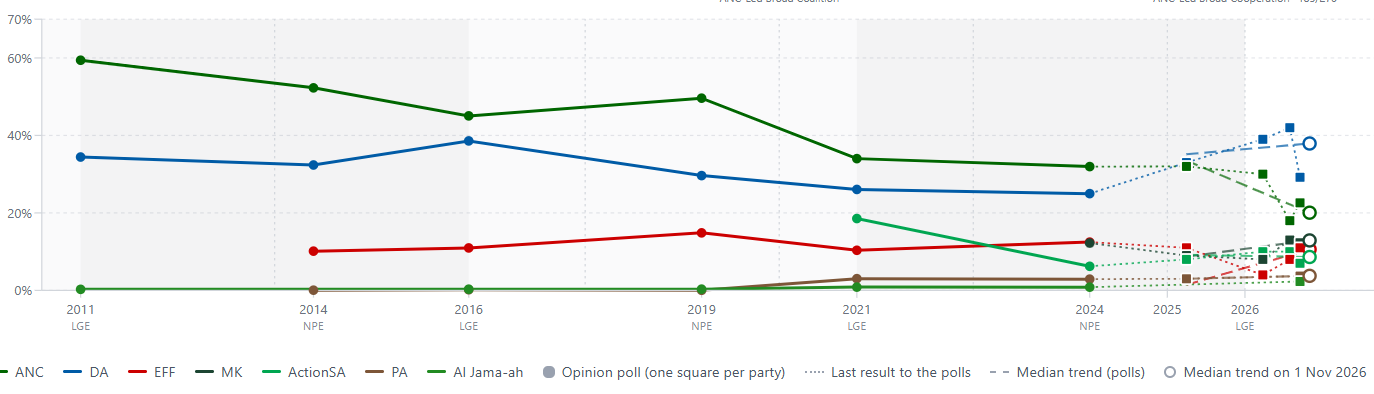
The page also sets out DA-led alternatives. The useful question is what must change for those alternatives to work: the DA’s support, the smaller parties’ performance, their willingness to cooperate, or some combination of all three. A favourable trend for one party does not settle the negotiations that follow.
In eThekwini, Norsira’s outlook describes its base case as the least certain among the metros. It envisages a Government of Local Unity (GLU), involving the DA, Inkatha Freedom Party (IFP) and ANC, potentially needing additional support. MK-led alternatives remain on the table.
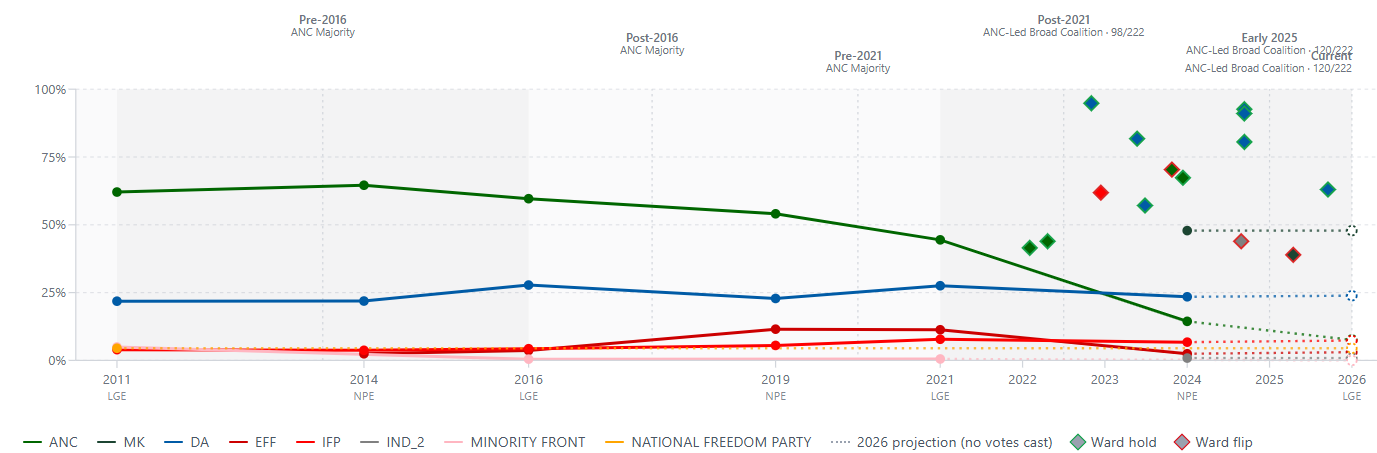
The chart illustrates the scale of the political change Norsira is examining. The ANC’s historical support falls sharply while MK enters the picture. Translating that change into a municipal administration requires assumptions about turnout, seats and coalition choices. Norsira’s contribution is to make those assumptions available for scrutiny.
The smaller councils provide another test of broad political narratives. In Beaufort West, Norsira rates the contest Leaning. Its outlook describes a DA majority of seven seats in a 13-seat council: enough to govern, but with little room for a setback.
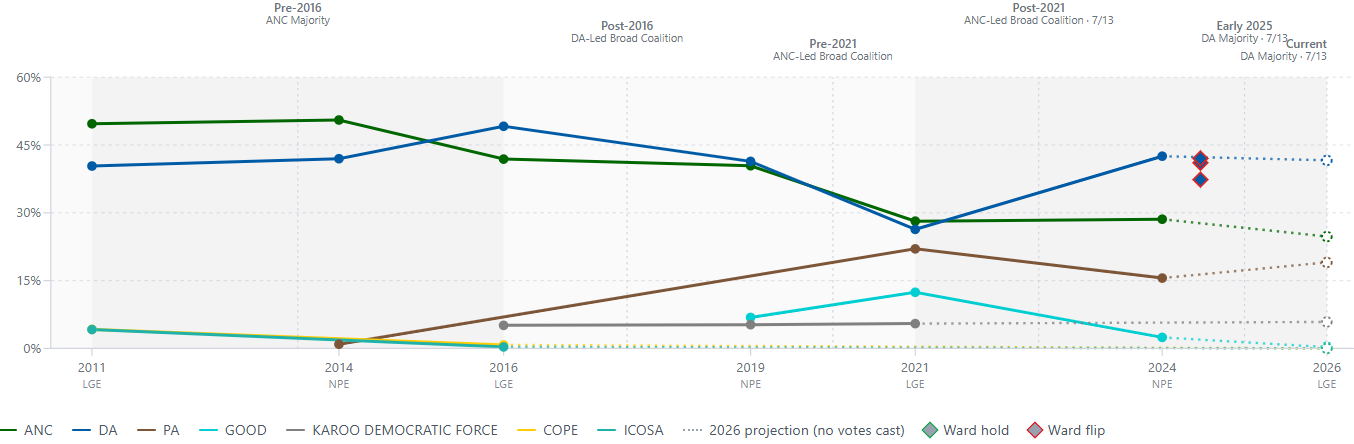
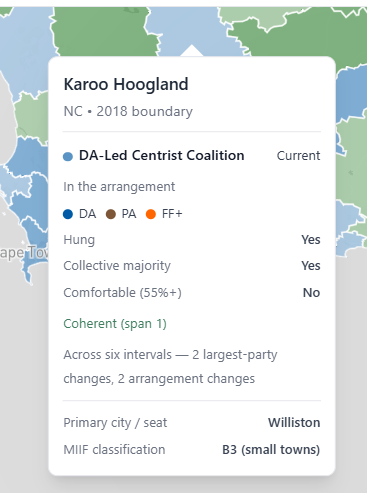
Karoo Hoogland raises a different question: which partners are available? Norsira’s political-control card identifies a DA, PA and Freedom Front Plus (FF+) arrangement. Its outlook treats this as an early indication of possible cooperation elsewhere, while cautioning against assuming that the PA will make the same choice in every council.
In uMngeni, Norsira’s base case is a DA majority of 14 out of 25 seats. It links the party’s resilience partly to mayor Chris Pappas. That is an interpretation of local political performance; the chart alone cannot establish how much support any individual mayor caused.
George shows how two apparently competing stories can coexist. Norsira reports PA gains in by-elections while still expecting the DA, FF+ and African Christian Democratic Party coalition to hold. A strong result in selected wards does not by itself describe the balance across an entire municipality.
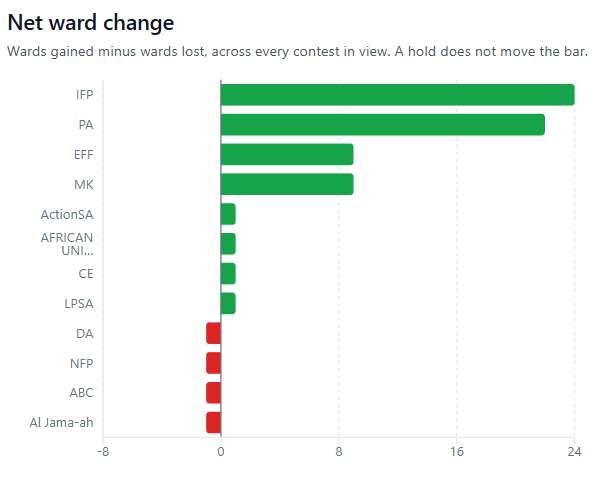
That caution also applies to the net ward-change graphic. It shows the IFP and PA with the largest positive bars among the parties displayed. It counts wards gained minus wards lost in the contests included in the view. It is not a national vote-share chart, and it does not measure the probability of winning a council.
There are limits to what this evidence can tell us. By-elections cover particular wards rather than a random sample of the electorate. Polls have their own sampling and turnout assumptions. Historical election lines can combine ballots cast for different spheres of government. Norsira’s Johannesburg methodology also states that its same-ward comparisons have partial coverage, counting only contests with a parsed ward and a 2021 baseline.
There is a useful counterpoint to the outlook’s emphasis on ANC decline. Norsira identifies Senqu, Emalahleni in the Eastern Cape, and Great Kei as comparatively strong performers on its own service-delivery score. This is Norsira’s assessment, rather than an independent audit, but it challenges the idea that a party label alone explains municipal performance.
The MERIT service-delivery page adds a way to examine performance alongside political control. It presents scores, national ranks and comparisons with councils of similar size. It explicitly labels its final two scoring years, 2025/26 and 2026/27, as projections rather than measurements, and warns that changing weights affect comparisons of scores over time. The page also says the underlying inputs cannot be recovered from its results table. A ranking can prompt an investigation; it cannot, on its own, explain why a municipality succeeds or fails.
For Truth Report, the value of this partnership lies in more precise reporting: distinguishing evidence from interpretation, identifying the assumptions behind a scenario and recognising when the facts complicate a preferred political story. Our responsibility is to question the analysis as well as explain it.
Getting closer to the truth means making uncertainty understandable. The eventual test reaches beyond which party takes the mayor’s office to whether the resulting administration can govern consistently and improve residents’ lives.


